sportslabkit.dataframe#
Overview#
- |
|
Bounding box data frame. |
|
- |
Classes#
- class sportslabkit.dataframe.BaseSLKDataFrame[source]#
Bases:
pandas.DataFrameOverview
Methods# save_dataframe(path_or_buf)Save a dataframe to a file.
get_data(frame, playerid, teamid, attributes)Get specific data from the dataframe.
iter_frames(apply_func)Iterate over the frames of the dataframe.
iter_players(apply_func, drop)Iterate over the players of the dataframe.
iter_teams(apply_func, drop)Iterate over the teams of the dataframe.
iter_attributes(apply_func, drop)Iterate over the attributes of the dataframe.
to_long_df(level, dropna)Convert a dataframe to a long format.
Check if the dataframe is in long format.
get_frame(frame)Get a specific frame from the dataframe.
Members
- save_dataframe(path_or_buf: FilePath | WriteBuffer[bytes] | WriteBuffer[str]) None#
Save a dataframe to a file.
- get_data(frame=None, playerid=None, teamid=None, attributes=None)#
Get specific data from the dataframe.
- Parameters:
- Returns:
Dataframe with the selected data.
- Return type:
pd.DataFrame
- iter_frames(apply_func=None)#
Iterate over the frames of the dataframe.
- Parameters:
apply_func (function, optional) – Function to apply to each group. Defaults to None.
- iter_players(apply_func=None, drop=True)#
Iterate over the players of the dataframe.
- Parameters:
apply_func (function, optional) – Function to apply to each group. Defaults to None.
drop (bool, optional) – Drop the level of the dataframe. Defaults to True.
- iter_teams(apply_func=None, drop=True)#
Iterate over the teams of the dataframe.
- Parameters:
apply_func (function, optional) – Function to apply to each group. Defaults to None.
drop (bool, optional) – Drop the level of the dataframe. Defaults to True.
- iter_attributes(apply_func=None, drop=True)#
Iterate over the attributes of the dataframe.
- Parameters:
apply_func (function, optional) – Function to apply to each group. Defaults to None.
drop (bool, optional) – Drop the level of the dataframe. Defaults to True.
- to_long_df(level='Attributes', dropna=True)#
Convert a dataframe to a long format.
- Parameters:
df (pd.DataFrame) – Dataframe to convert.
level (str, optional) – Level to convert to long format. Defaults to ‘Attributes’. Options are ‘Attributes’, ‘TeamID’, ‘PlayerID’.
- Returns:
Dataframe in long format.
- Return type:
pd.DataFrame
- is_long_format()#
Check if the dataframe is in long format.
- Returns:
True if the dataframe is in long format, False otherwise.
- Return type:
- class sportslabkit.dataframe.BBoxDataFrame[source]#
Bases:
sportslabkit.dataframe.base.BaseSLKDataFrameBounding box data frame.
- Parameters:
pd.DataFrame (pd.DataFrame) – Pandas DataFrame object.
- Returns:
Bounding box data frame.
- Return type:
Note
The bounding box data frame is a pandas DataFrame object with the following MultiIndex structure: Level 0: Team ID(str) Level 1: Player ID(str) Level 2: Attribute
- and the following attributes:
frame (float): Frame ID. bb_left (float): Bounding box left coordinate. bb_top (float): Bounding box top coordinate. bb_width (float): Bounding box width. bb_height (float): Bounding box height. conf (float): Confidence of the bounding box.
Since SoccerTrack basically only handles ball and person classes, class_id, etc. are not included in the BBoxDataframe for simplicity. However, they are needed for visualization and calculation of evaluation indicators, so they are generated as needed in additional attributes.
Overview
Methods# visualize_frame(frame_idx, frame, draw_frame_id)Visualize the bounding box of the specified frame.
visualize_frames(video_path, save_path, **kwargs)Visualize bounding boxes on a video.
abc Convert a dataframe to the YOLO format.
to_yolov5_format(mapping, na_class, h, w, save_dir)Convert a dataframe to the YOLOv5 format.
Convert a dataframe to the MOT format.
Convert a dataframe to the Labelbox segment format.
to_labelbox_data(data_row, schema_lookup)Convert a dataframe to the Labelbox format.
to_list_of_tuples_format(mapping, na_class)Convert a dataframe to a list of tuples.
to_codf(H, method)Converts bounding box dataframe to a new coordinate dataframe using a given homography matrix.
Preprocess a dataframe for evaluation using the MOT metrics.
from_dict(d, attributes)static Create a BBoxDataFrame from a nested dictionary contating the coordinates of the players and the ball.
Members
- visualize_frame(frame_idx: int, frame: numpy.ndarray, draw_frame_id: bool = False) numpy.ndarray#
Visualize the bounding box of the specified frame.
- Parameters:
self (BBoxDataFrame) – BBoxDataFrame object.
frame_idx (int) – Frame ID.
frame (np.ndarray) – Frame image.
draw_frame_id (bool, optional) – Whether to draw the frame ID. Defaults to False.
- Returns:
Frame image with bounding box.
- Return type:
frame(np.ndarray)
- visualize_frames(video_path: str, save_path: str, **kwargs) None#
Visualize bounding boxes on a video.
- Parameters:
video_path (str) – Path to the video file.
- Returns:
None
- abstract to_yolo_format()#
Convert a dataframe to the YOLO format.
- Returns:
Dataframe in YOLO format.
- Return type:
pd.DataFrame
- to_yolov5_format(mapping: dict[dict[Any, Any], dict[Any, Any]] | None = None, na_class: int = 0, h: int | None = None, w: int | None = None, save_dir: str | None = None)#
Convert a dataframe to the YOLOv5 format.
Converts a dataframe to the YOLOv5 format. The specification for each line is as follows: <class_id> <x_center> <y_center> <width> <height>
One row per object
Each row is class x_center y_center width height format.
Box coordinates must be normalized by the dimensions of the image (i.e. have values between 0 and 1)
Class numbers are zero-indexed (start from 0).
- Parameters:
mapping (dict, optional) – Mappings from team_id and player_id to class_id. Should contain one or two nested dictionaries like {‘TeamID’:{0:1}, ‘PlayerID’:{0:1}}. Defaults to None. If None,the class_id will be inferred from the team_id and player_id and set such that players=0 and ball=1.
na_class (int, optional) – Class ID for NaN values. Defaults to 0.
h (int, optional) – Height of the image. Unnecessary if the dataframe has height metadata. Defaults to None.
w (int, optional) – Width of the image. Unnecessary if the dataframe has width metadata. Defaults to None.
save_dir (str, optional) – If specified, saves a text file for each frame in the specified directory. Defaults to None.
- Returns:
list of shape (N, M, 5) in YOLOv5 format. Where N is the number of frames, M is the number of objects in the frame, and 5 is the number of attributes (class_id, x_center, y_center, width, height).
- Return type:
- to_mot_format()#
Convert a dataframe to the MOT format.
- Returns:
Dataframe in MOT format.
- Return type:
pd.DataFrame
- to_labelbox_segment() dict#
Convert a dataframe to the Labelbox segment format.
- Parameters:
self (BBoxDataFrame) – BBoxDataFrame object.
- Returns:
Dictionary in Labelbox segment format.
- Return type:
segment
Notes
The Labelbox segment format is a dictionary with the following structure: {feature_name:
- {keyframes:
- {frame:
- {bbox:
{top: XX, left: XX, height: XX, width: XX},
label: label }
}, {frame: …
}
}
}
- to_labelbox_data(data_row: object, schema_lookup: dict) list#
Convert a dataframe to the Labelbox format.
- Parameters:
self (BBoxDataFrame) – BBoxDataFrame object.
data_row (DataRow) – DataRow object.
schema_lookup (dict) – Dictionary of label names and label ids.
- Returns:
List of dictionaries in Labelbox format.
- Return type:
uploads(list)
- to_list_of_tuples_format(mapping: dict[dict[Any, Any], dict[Any, Any]] | None = None, na_class: int | str = 'player')#
Convert a dataframe to a list of tuples.
Converts a dataframe to a list of tuples necessary for calculating object detection metrics such as mAP and AP scores. The specification for each list element is as follows: (x, y, w, h, confidence, class_id, image_name, object_id)
- Returns:
List of tuples.
- Return type:
- to_codf(H: numpy.ndarray, method: str = 'bottom_middle') sportslabkit.dataframe.coordinatesdataframe.CoordinatesDataFrame#
Converts bounding box dataframe to a new coordinate dataframe using a given homography matrix.
This function takes a dataframe of bounding boxes and applies a perspective transformation to a specified point within each bounding box (e.g., center, bottom middle, top middle) into a new coordinate frame (e.g., a pitch coordinate frame). The result is returned as a CoordinatesDataFrame.
- Parameters:
self (BBoxDataFrame) – A dataframe containing bounding box coordinates.
H (np.ndarray) – A 3x3 homography matrix used for the perspective transformation.
method (str) – Method to determine the point within the bounding box to transform. Options include ‘center’, ‘bottom_middle’, ‘top_middle’.
- Returns:
A dataframe containing the transformed coordinates.
- Return type:
Example
H = np.array([[1, 0, 0], [0, 1, 0], [0, 0, 1]]) bbox_data = BBoxDataFrame(…) codf = bbox_data.to_codf(H, method=’bottom_middle’)
- preprocess_for_mot_eval()#
Preprocess a dataframe for evaluation using the MOT metrics.
- Parameters:
self (BBoxDataFrame) – BBoxDataFrame object.
- Returns:
List of lists of object ids for each frame. dets (list): A list of arrays of detections in the format (x, y, w, h) for each frame.
- Return type:
ids (list)
- static from_dict(d: dict, attributes: Iterable[str] | None = ('bb_left', 'bb_top', 'bb_width', 'bb_height'))#
Create a BBoxDataFrame from a nested dictionary contating the coordinates of the players and the ball.
The input dictionary should be of the form: {
- home_team_key: {
PlayerID: {frame: [x, y], …}, PlayerID: {frame: [x, y], …}, …
}, away_team_key: {
PlayerID: {frame: [x, y], …}, PlayerID: {frame: [x, y], …}, …
}, ball_key: {
frame: [x, y], frame: [x, y], …
}
} The PlayerID can be any unique identifier for the player, e.g. their jersey number or name. The PlayerID for the ball can be omitted, as it will be set to “0”. frame must be an integer identifier for the frame number.
- Parameters:
- Returns:
CoordinatesDataFrame.
- Return type:
- class sportslabkit.dataframe.CoordinatesDataFrame[source]#
Bases:
sportslabkit.dataframe.base.BaseSLKDataFrame,pandas.DataFrameOverview
Methods# set_keypoints(source_keypoints, target_keypoints, mapping, mapping_file)Set the keypoints for the homography transformation. Make sure that
to_pitch_coordinates(drop)Convert image coordinates to pitch coordinates.
from_numpy(arr, team_ids, player_ids, attributes, auto_fix_columns)static Create a CoordinatesDataFrame from a numpy array of either shape (L, N, 2) or (L, N * 2) where L is the number of frames, N is the number of players and 2 is the number of coordinates (x, y).
from_dict(d, attributes)static Create a CoordinatesDataFrame from a nested dictionary contating the coordinates of the players and the ball.
visualize_frame(frame_idx, save_path, ball_key, home_key, away_key, marker_kwargs, ball_kwargs, home_kwargs, away_kwargs, save_kwargs)Visualize a single frame.
visualize_frames(save_path, ball_key, home_key, away_key, marker_kwargs, ball_kwargs, home_kwargs, away_kwargs, save_kwargs)Visualize multiple frames using matplotlib.animation.FuncAnimation.
Members
- set_keypoints(source_keypoints: ArrayLike | None = None, target_keypoints: ArrayLike | None = None, mapping: Mapping | None = None, mapping_file: PathLike | None = None) None#
Set the keypoints for the homography transformation. Make sure that the target keypoints are the pitch coordinates. Also each keypoint must be a tuple of (Lon, Lat) or (x, y) coordinates.
- Parameters:
source_keypoints (Optional[ArrayLike], optional) – Keypoints in pitch space. Defaults to None.
target_keypoints (Optional[ArrayLike], optional) – Keypoints in video space. Defaults to None.
- to_pitch_coordinates(drop=True)#
Convert image coordinates to pitch coordinates.
- static from_numpy(arr: numpy.ndarray, team_ids: Iterable[str] | None = None, player_ids: Iterable[int] | None = None, attributes: Iterable[str] | None = ('x', 'y'), auto_fix_columns: bool = True)#
Create a CoordinatesDataFrame from a numpy array of either shape (L, N, 2) or (L, N * 2) where L is the number of frames, N is the number of players and 2 is the number of coordinates (x, y).
- Parameters:
arr – Numpy array.
team_ids – Team ids. Defaults to None. If None, team ids will be set to 0 for all players. If not None, must have the same length as player_ids
ids (Player) – Player ids. Defaults to None. If None, player ids will be set to 0 for all players. If not None, must have the same length as team_ids
attributes – Attribute names to use. Defaults to (“x”, “y”).
auto_fix_columns – If True, will automatically fix the team_ids, player_ids and attributes so that they are equal to the number of columns. Defaults to True.
- Returns:
CoordinatesDataFrame.
- Return type:
Examples
>>> from soccertrack.dataframe import CoordinatesDataFrame
>>> import numpy as np
>>> arr = np.random.rand(10, 22, 2)
>>> codf = CoordinatesDataFrame.from_numpy(arr, team_ids=["0"] * 22, player_ids=list(range(22)))
- static from_dict(d: dict, attributes: Iterable[str] | None = ('x', 'y'))#
Create a CoordinatesDataFrame from a nested dictionary contating the coordinates of the players and the ball.
The input dictionary should be of the form: {
- home_team_key: {
PlayerID: {frame: [x, y], …}, PlayerID: {frame: [x, y], …}, …
}, away_team_key: {
PlayerID: {frame: [x, y], …}, PlayerID: {frame: [x, y], …}, …
}, ball_key: {
frame: [x, y], frame: [x, y], …
}
} The PlayerID can be any unique identifier for the player, e.g. their jersey number or name. The PlayerID for the ball can be omitted, as it will be set to “0”. frame must be an integer identifier for the frame number.
- Parameters:
- Returns:
CoordinatesDataFrame.
- Return type:
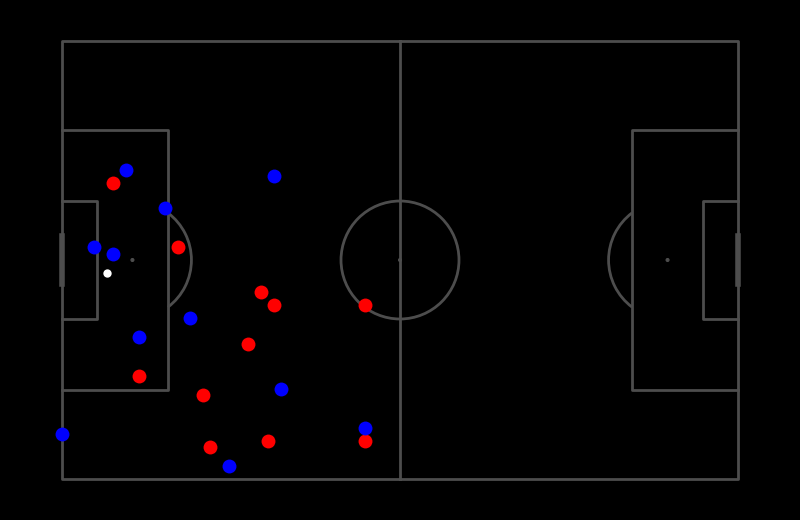
- visualize_frame(frame_idx: int, save_path: PathLike | None = None, ball_key: str = 'ball', home_key: str = '0', away_key: str = '1', marker_kwargs: dict[str, Any] | None = None, ball_kwargs: dict[str, Any] | None = None, home_kwargs: dict[str, Any] | None = None, away_kwargs: dict[str, Any] | None = None, save_kwargs: dict[str, Any] | None = None)#
Visualize a single frame.
Visualize a frame given a frame number and save it to a path. The CoordinatesDataFrame is expected to already have been normalized so that the pitch is 105x68, e.g. coordinates on the x-axis range from 0 to 105 and coordinates on the y-axis range from 0 to 68.
Similarly, you can pass keyword arguments to change the appearance of the markers. For example, to change the size of the markers, you can pass ms=6 to away_kwargs by, e.g. codf.visualize_frames(“animation.gif”, away_kwargs={“ms”: 6}). See the matplotlib.pyplot.plot documentation for more information. Note that marker_kwargs will be used for all markers but will be overwritten by ball_kwargs, home_kwargs and away_kwargs if a dictionary with the same key is passed (later dictionaries take precedence).
- Parameters:
frame_idx – Frame number.
save_path – Path to save the image. Defaults to None.
ball_key – Key (TeamID) for the ball. Defaults to “ball”.
home_key – Key (TeamID) for the home team. Defaults to “0”.
away_key – Key (TeamID) for the away team. Defaults to “1”.
marker_kwargs – Keyword arguments for the markers.
ball_kwargs – Keyword arguments specifically for the ball marker.
home_kwargs – Keyword arguments specifically for the home team markers.
away_kwargs – Keyword arguments specifically for the away team markers.
save_kwargs – Keyword arguments for the save function.
Note
marker_kwargs will be used for all markers but will be overwritten by ball_kwargs, home_kwargs and away_kwargs. All keyword arguments are passed to plt.plot. save_kwargs are passed to plt.savefig.
Warning
All keyword arguments are passed to plt.plot. If you pass an invalid keyword argument, you will get an error.
Example
>>> codf = CoordinatesDataFrame.from_numpy(np.random.randint(0, 105, (1, 23, 2)))
>>> codf.visualize_frame(0)
- visualize_frames(save_path: sportslabkit.types.types.PathLike, ball_key: str = 'ball', home_key: str = '0', away_key: str = '1', marker_kwargs: dict[str, Any] | None = None, ball_kwargs: dict[str, Any] | None = None, home_kwargs: dict[str, Any] | None = None, away_kwargs: dict[str, Any] | None = None, save_kwargs: dict[str, Any] | None = None)#
Visualize multiple frames using matplotlib.animation.FuncAnimation.
Visualizes the frames and generates a pitch animation. The CoordinatesDataFrame is expected to already have been normalized so that the pitch is 105x68, e.g. coordinates on the x-axis range from 0 to 105 and coordinates on the y-axis range from 0 to 68.
To customize the animation, you can pass keyword arguments to matplotlib.animation.FuncAnimation. For example, to change the frame rate, you can pass fps=30 to save_kwargs by, e.g. codf.visualize_frames(“animation.gif”, save_kwargs={“fps”: 30}). See the matplotlib.animation.FuncAnimation documentation for more information.
Similarly, you can pass keyword arguments to change the appearance of the markers. For example, to change the size of the markers, you can pass ms=6 to away_kwargs by, e.g. codf.visualize_frames(“animation.gif”, away_kwargs={“ms”: 6}). See the matplotlib.pyplot.plot documentation for more information. Note that marker_kwargs will be used for all markers but will be overwritten by ball_kwargs, home_kwargs and away_kwargs if a dictionary with the same key is passed (later dictionaries take precedence).
- Parameters:
frame_idx – Frame number.
save_path – Path to save the image. Defaults to None.
ball_key – Key (TeamID) for the ball. Defaults to “ball”.
home_key – Key (TeamID) for the home team. Defaults to “0”.
away_key – Key (TeamID) for the away team. Defaults to “1”.
marker_kwargs – Keyword arguments for the markers.
ball_kwargs – Keyword arguments specifically for the ball marker.
home_kwargs – Keyword arguments specifically for the home team markers.
away_kwargs – Keyword arguments specifically for the away team markers.
save_kwargs – Keyword arguments for the save function.
Note
marker_kwargs will be used for all markers but will be overwritten by ball_kwargs, home_kwargs and away_kwargs. All keyword arguments are passed to plt.plot. save_kwargs are passed to FuncAnimation.save.
Warning
All keyword arguments are passed either to plt.plot and FuncAnimation.save. If you pass an invalid keyword argument, you will get an error.
Example
>>> codf = load_codf("/path/to/codf.csv")
>>> codf.visualize_frames("/path/to/save.mp4")
...
# Heres a demo using random data
>>> codf = CoordinatesDataFrame.from_numpy(np.random.randint(0, 50, (1, 23, 2)))
>>> codf = codf.loc[codf.index.repeat(5)] # repeat the same frame 5 times
>>> codf += np.array([[0,1,2,3,4]]).T # add some movment
>>> codf.visualize_frames('visualize_frames.gif', save_kwargs={'fps':2})