sportslabkit.dataframe.coordinatesdataframe#
Overview#
- |
|
Merge dictionaries. |
Classes#
- class sportslabkit.dataframe.coordinatesdataframe.CoordinatesDataFrame[source]#
Bases:
sportslabkit.dataframe.base.BaseSLKDataFrame,pandas.DataFrameOverview
Methods# set_keypoints(source_keypoints, target_keypoints, mapping, mapping_file)Set the keypoints for the homography transformation. Make sure that
to_pitch_coordinates(drop)Convert image coordinates to pitch coordinates.
from_numpy(arr, team_ids, player_ids, attributes, auto_fix_columns)static Create a CoordinatesDataFrame from a numpy array of either shape (L, N, 2) or (L, N * 2) where L is the number of frames, N is the number of players and 2 is the number of coordinates (x, y).
from_dict(d, attributes)static Create a CoordinatesDataFrame from a nested dictionary contating the coordinates of the players and the ball.
visualize_frame(frame_idx, save_path, ball_key, home_key, away_key, marker_kwargs, ball_kwargs, home_kwargs, away_kwargs, save_kwargs)Visualize a single frame.
visualize_frames(save_path, ball_key, home_key, away_key, marker_kwargs, ball_kwargs, home_kwargs, away_kwargs, save_kwargs)Visualize multiple frames using matplotlib.animation.FuncAnimation.
Members
- set_keypoints(source_keypoints: ArrayLike | None = None, target_keypoints: ArrayLike | None = None, mapping: Mapping | None = None, mapping_file: PathLike | None = None) None[source]#
Set the keypoints for the homography transformation. Make sure that the target keypoints are the pitch coordinates. Also each keypoint must be a tuple of (Lon, Lat) or (x, y) coordinates.
- Parameters:
source_keypoints (Optional[ArrayLike], optional) – Keypoints in pitch space. Defaults to None.
target_keypoints (Optional[ArrayLike], optional) – Keypoints in video space. Defaults to None.
- static from_numpy(arr: numpy.ndarray, team_ids: Iterable[str] | None = None, player_ids: Iterable[int] | None = None, attributes: Iterable[str] | None = ('x', 'y'), auto_fix_columns: bool = True)[source]#
Create a CoordinatesDataFrame from a numpy array of either shape (L, N, 2) or (L, N * 2) where L is the number of frames, N is the number of players and 2 is the number of coordinates (x, y).
- Parameters:
arr – Numpy array.
team_ids – Team ids. Defaults to None. If None, team ids will be set to 0 for all players. If not None, must have the same length as player_ids
ids (Player) – Player ids. Defaults to None. If None, player ids will be set to 0 for all players. If not None, must have the same length as team_ids
attributes – Attribute names to use. Defaults to (“x”, “y”).
auto_fix_columns – If True, will automatically fix the team_ids, player_ids and attributes so that they are equal to the number of columns. Defaults to True.
- Returns:
CoordinatesDataFrame.
- Return type:
Examples
>>> from soccertrack.dataframe import CoordinatesDataFrame
>>> import numpy as np
>>> arr = np.random.rand(10, 22, 2)
>>> codf = CoordinatesDataFrame.from_numpy(arr, team_ids=["0"] * 22, player_ids=list(range(22)))
- static from_dict(d: dict, attributes: Iterable[str] | None = ('x', 'y'))[source]#
Create a CoordinatesDataFrame from a nested dictionary contating the coordinates of the players and the ball.
The input dictionary should be of the form: {
- home_team_key: {
PlayerID: {frame: [x, y], …}, PlayerID: {frame: [x, y], …}, …
}, away_team_key: {
PlayerID: {frame: [x, y], …}, PlayerID: {frame: [x, y], …}, …
}, ball_key: {
frame: [x, y], frame: [x, y], …
}
} The PlayerID can be any unique identifier for the player, e.g. their jersey number or name. The PlayerID for the ball can be omitted, as it will be set to “0”. frame must be an integer identifier for the frame number.
- Parameters:
- Returns:
CoordinatesDataFrame.
- Return type:
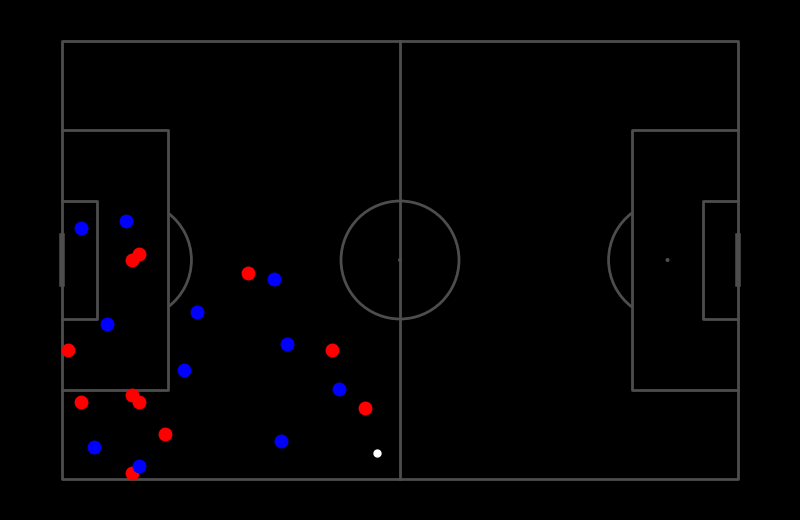
- visualize_frame(frame_idx: int, save_path: PathLike | None = None, ball_key: str = 'ball', home_key: str = '0', away_key: str = '1', marker_kwargs: dict[str, Any] | None = None, ball_kwargs: dict[str, Any] | None = None, home_kwargs: dict[str, Any] | None = None, away_kwargs: dict[str, Any] | None = None, save_kwargs: dict[str, Any] | None = None)[source]#
Visualize a single frame.
Visualize a frame given a frame number and save it to a path. The CoordinatesDataFrame is expected to already have been normalized so that the pitch is 105x68, e.g. coordinates on the x-axis range from 0 to 105 and coordinates on the y-axis range from 0 to 68.
Similarly, you can pass keyword arguments to change the appearance of the markers. For example, to change the size of the markers, you can pass ms=6 to away_kwargs by, e.g. codf.visualize_frames(“animation.gif”, away_kwargs={“ms”: 6}). See the matplotlib.pyplot.plot documentation for more information. Note that marker_kwargs will be used for all markers but will be overwritten by ball_kwargs, home_kwargs and away_kwargs if a dictionary with the same key is passed (later dictionaries take precedence).
- Parameters:
frame_idx – Frame number.
save_path – Path to save the image. Defaults to None.
ball_key – Key (TeamID) for the ball. Defaults to “ball”.
home_key – Key (TeamID) for the home team. Defaults to “0”.
away_key – Key (TeamID) for the away team. Defaults to “1”.
marker_kwargs – Keyword arguments for the markers.
ball_kwargs – Keyword arguments specifically for the ball marker.
home_kwargs – Keyword arguments specifically for the home team markers.
away_kwargs – Keyword arguments specifically for the away team markers.
save_kwargs – Keyword arguments for the save function.
Note
marker_kwargs will be used for all markers but will be overwritten by ball_kwargs, home_kwargs and away_kwargs. All keyword arguments are passed to plt.plot. save_kwargs are passed to plt.savefig.
Warning
All keyword arguments are passed to plt.plot. If you pass an invalid keyword argument, you will get an error.
Example
>>> codf = CoordinatesDataFrame.from_numpy(np.random.randint(0, 105, (1, 23, 2)))
>>> codf.visualize_frame(0)
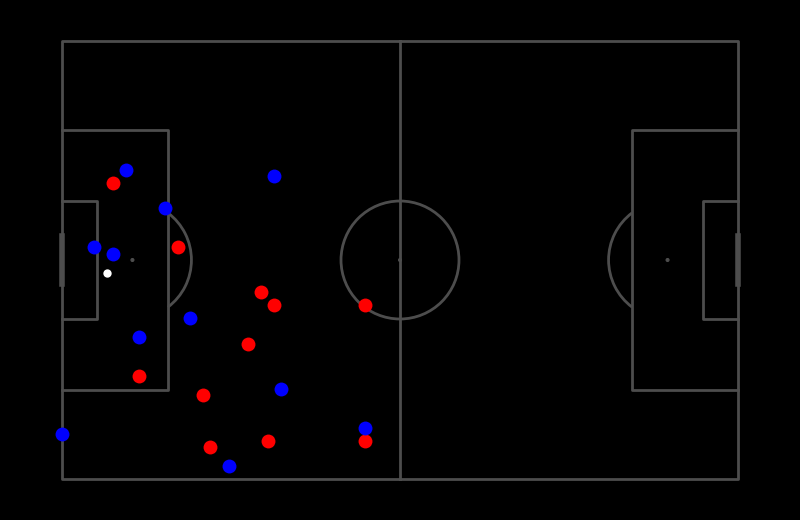
- visualize_frames(save_path: sportslabkit.types.types.PathLike, ball_key: str = 'ball', home_key: str = '0', away_key: str = '1', marker_kwargs: dict[str, Any] | None = None, ball_kwargs: dict[str, Any] | None = None, home_kwargs: dict[str, Any] | None = None, away_kwargs: dict[str, Any] | None = None, save_kwargs: dict[str, Any] | None = None)[source]#
Visualize multiple frames using matplotlib.animation.FuncAnimation.
Visualizes the frames and generates a pitch animation. The CoordinatesDataFrame is expected to already have been normalized so that the pitch is 105x68, e.g. coordinates on the x-axis range from 0 to 105 and coordinates on the y-axis range from 0 to 68.
To customize the animation, you can pass keyword arguments to matplotlib.animation.FuncAnimation. For example, to change the frame rate, you can pass fps=30 to save_kwargs by, e.g. codf.visualize_frames(“animation.gif”, save_kwargs={“fps”: 30}). See the matplotlib.animation.FuncAnimation documentation for more information.
Similarly, you can pass keyword arguments to change the appearance of the markers. For example, to change the size of the markers, you can pass ms=6 to away_kwargs by, e.g. codf.visualize_frames(“animation.gif”, away_kwargs={“ms”: 6}). See the matplotlib.pyplot.plot documentation for more information. Note that marker_kwargs will be used for all markers but will be overwritten by ball_kwargs, home_kwargs and away_kwargs if a dictionary with the same key is passed (later dictionaries take precedence).
- Parameters:
frame_idx – Frame number.
save_path – Path to save the image. Defaults to None.
ball_key – Key (TeamID) for the ball. Defaults to “ball”.
home_key – Key (TeamID) for the home team. Defaults to “0”.
away_key – Key (TeamID) for the away team. Defaults to “1”.
marker_kwargs – Keyword arguments for the markers.
ball_kwargs – Keyword arguments specifically for the ball marker.
home_kwargs – Keyword arguments specifically for the home team markers.
away_kwargs – Keyword arguments specifically for the away team markers.
save_kwargs – Keyword arguments for the save function.
Note
marker_kwargs will be used for all markers but will be overwritten by ball_kwargs, home_kwargs and away_kwargs. All keyword arguments are passed to plt.plot. save_kwargs are passed to FuncAnimation.save.
Warning
All keyword arguments are passed either to plt.plot and FuncAnimation.save. If you pass an invalid keyword argument, you will get an error.
Example
>>> codf = load_codf("/path/to/codf.csv")
>>> codf.visualize_frames("/path/to/save.mp4")
...
# Heres a demo using random data
>>> codf = CoordinatesDataFrame.from_numpy(np.random.randint(0, 50, (1, 23, 2)))
>>> codf = codf.loc[codf.index.repeat(5)] # repeat the same frame 5 times
>>> codf += np.array([[0,1,2,3,4]]).T # add some movment
>>> codf.visualize_frames('visualize_frames.gif', save_kwargs={'fps':2})